A critical wake-up call for facility leaders
The problem is getting worse, not better
If you manage commercial facilities, you already know the drill: budgets get cut, maintenance gets deferred, and the backlog grows. What you might not know is just how catastrophic this trend has become—and how quickly it’s accelerating.
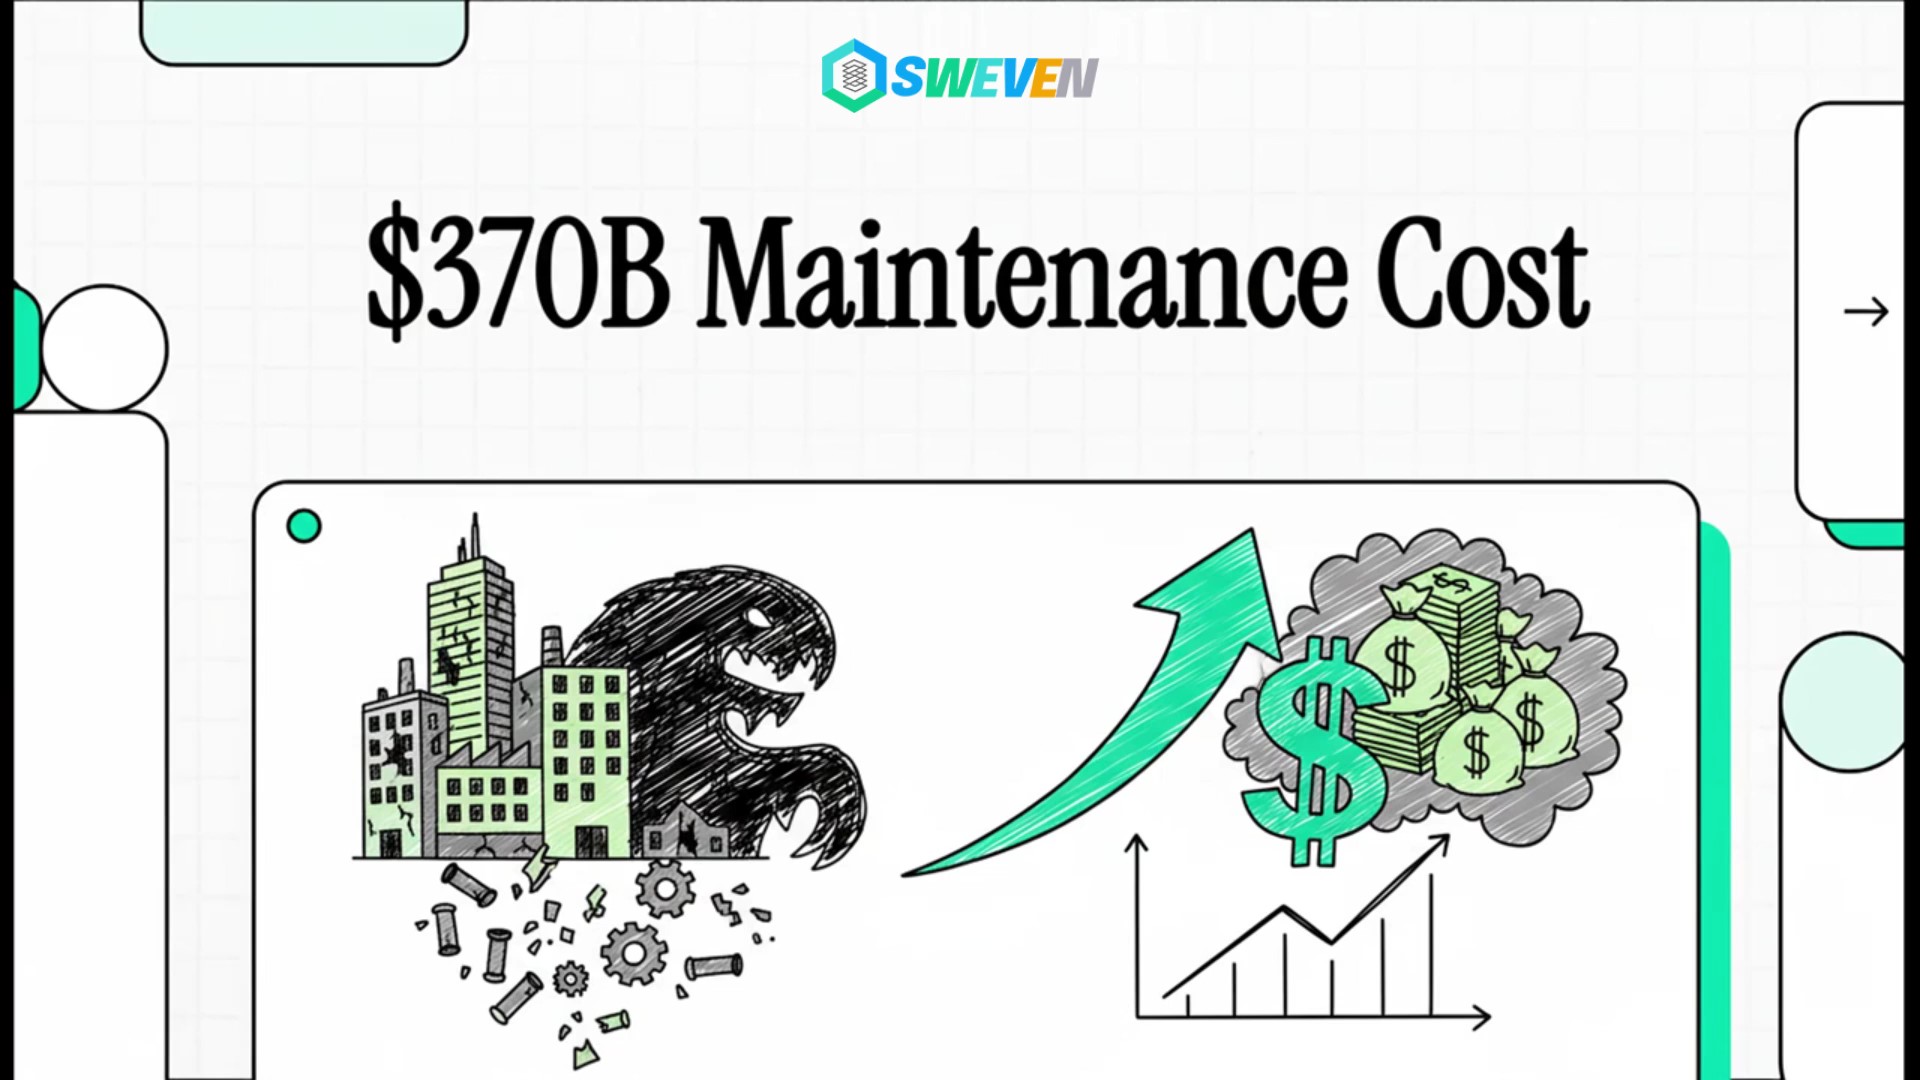
Prefer a quick visual rundown? Watch this 5-minute overview of the deferred maintenance cost dynamics.
The numbers don’t lie:
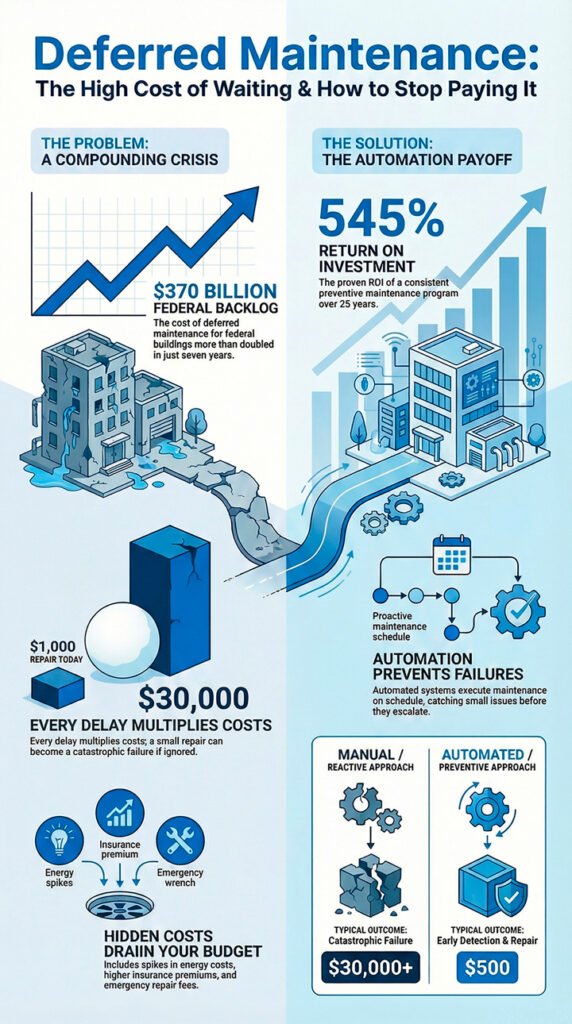
In 2017, federal building deferred maintenance stood at $171 billion. By 2024, that number exploded to $370 billion—more than doubling in just seven years.[1]
This isn’t just a government problem. According to industry reports, U.S. commercial facility backlogs now exceed $500 billion, with the average organization carrying over 12% of asset value in deferred repairs.[2]
And here’s the most alarming part: deferred maintenance compounds at 7% annually[3], meaning every $1,000 repair you postpone today could cost you $7,000 in seven years—and up to $30,000 if cascading failures occur.[4]
Why this matters to your bottom line
The real cost of «saving money»
When facility managers defer maintenance to preserve short-term cash flow, they’re not saving money—they’re borrowing from tomorrow at catastrophic interest rates.
Consider these industry realities:
- Half of all commercial buildings were constructed before 1980, with a median age of 32 years[5]
- Repair costs increase exponentially when maintenance is deferred—what costs $500 today could require a $15,000 replacement in 24 months[6]
- Buildings deteriorate faster than you think—without regular service, equipment lifespan decreases by 20-25%[7]
- Energy costs spike—the U.S. Department of Energy calculated that deferred maintenance adds $1.16 per square foot annually in utility costs alone[8]
The compounding effect
The U.S. Government Accountability Office (GAO) recently elevated building condition to its High-Risk List for the first time in 2025, citing «large increases in the cost of addressing deferred maintenance.»[1]
Officials attribute the increases to:
- Funding constraints
- Rising labor and material costs
- Aging building portfolios
- Most critically: the compounding nature of deferred work
As GAO reported: «Unless this trend reverses, federal assets will continue to deteriorate and need premature replacement, which can be significantly more expensive than if maintenance and repairs were done when originally scheduled.»[1]
The hidden costs you’re already paying
Beyond the obvious repair expenses, deferred maintenance creates cascading costs:
1. Liability and safety risks
Structural deterioration, failed compliance inspections, and unsafe conditions expose you to:
- Regulatory fines and penalties
- Increased insurance premiums (30%+ in recent years for poorly maintained buildings)[9]
- Litigation costs if occupants are harmed
- Reputational damage
2. Operational disruption
Emergency breakdowns don’t happen during business hours—they happen at 2 AM on Saturday:
- Lost productivity from equipment downtime
- Emergency service premiums (3-5x normal rates)
- Tenant complaints and retention issues
- Mission-critical operations interrupted
3. Budget unpredictability
Reactive maintenance makes financial planning impossible:
- Emergency repairs blow through quarterly budgets
- Capital replacement cycles accelerate
- No visibility into actual facility health
- CFOs lose confidence in FM cost projections
4. Competitive disadvantage
In today’s market, building quality matters:
- Lower tenant satisfaction scores
- Reduced occupancy rates
- Decreased property valuations
- Higher operating costs per square foot
The solution: automated preventive maintenance at scale
Here’s what facility leaders need to understand: the problem isn’t just deferred maintenance—it’s the manual systems that allow critical work to be deferred in the first place.
Why manual scheduling fails
Traditional approaches rely on:
- ✗ Spreadsheets that get outdated
- ✗ Facility managers remembering dates
- ✗ Manual creation of recurring work orders
- ✗ Email chains to track vendor responses
- ✗ Phone calls to check status
Result: Inspections get missed. Schedules slip. Small issues compound. The backlog grows.
The automated alternative
Industry experts recommend allocating 2-6% of annual operating budgets to preventive maintenance to effectively minimize facility decay.[10] But allocation doesn’t matter if execution fails.
Modern facility maintenance engines execute preventive work automatically:
How it works:
- Configure once: Set inspection schedules based on asset type, age, and criticality
- Automatic execution: System generates work orders, assigns qualified vendors, and monitors completion—24/7/365
- No human dependency: Schedules execute whether facility managers remember them or not
- Escalation built-in: If a vendor doesn’t respond, system automatically escalates to backup providers
- Complete audit trail: Every inspection, finding, and resolution tracked for compliance
The difference:
- Manual management: Inspections get missed → issues compound → catastrophic failures → $30,000 repairs
- Automated execution: Every inspection happens → issues caught early → preventive action → $500 repairs
The ROI is undeniable
A landmark study analyzing 14 million square feet of commercial properties demonstrated that preventive maintenance delivers a 545% return on investment over 25 years.[11]
The math:
- Preventive maintenance: $0.33 per square foot annually[11]
- Avoided emergency repairs: $1.50+ per square foot annually
- Extended equipment life: 20-25% longer than reactive maintenance[7]
- Energy savings: $1.16 per square foot annually[8]
For a 100,000 square foot facility:
- Annual preventive maintenance investment: $33,000
- Annual avoided costs: $150,000+ (emergency repairs + energy + extended equipment life)
- Net annual benefit: $117,000+
- 10-year benefit: $1.17 million
And that’s before calculating the value of avoided liability, improved tenant retention, and predictable budgeting.
What action looks like
Step 1: Assess your current state
- What percentage of your asset value is sitting in deferred maintenance?
- How many critical inspections were missed in the past 12 months?
- What’s your reactive vs. preventive maintenance ratio?
- How often are you surprised by emergency repairs?
Step 2: Calculate your real costs
- Emergency repair premiums paid last year
- Equipment replaced prematurely due to lack of maintenance
- Energy cost increases from poorly maintained systems
- Staff time spent on manual scheduling and vendor coordination
Step 3: Implement automation
The facility leaders who are winning this battle have one thing in common: they’ve stopped relying on manual processes to execute critical work.
They’re implementing automated maintenance engines that:
- Execute preventive schedules across hundreds of sites simultaneously
- Monitor equipment health in real-time through connected sensors
- Assign work to optimal vendors based on location, specialty, and performance
- Escalate automatically when work is at risk
- Provide executive dashboards with portfolio-wide visibility
The result: Deferred maintenance stops growing. Backlogs shrink. Budgets stabilize. Assets last longer.
The bottom line
You can’t budget your way out of deferred maintenance using manual processes.
The data is clear: deferred maintenance is doubling every 7-8 years. Manual scheduling and execution can’t keep pace with the scale of modern facility portfolios.
The question isn’t whether to automate—it’s whether you’ll automate before your competitors do, or after your deferred maintenance backlog becomes a crisis.
The facilities that thrive in 2026 and beyond will be the ones that let technology execute the work while humans focus on strategy.
Stop deferring. Start automating.
References
[1] U.S. Government Accountability Office (GAO). (2025). «Federal Real Property: Disposing of Unneeded Facilities Could Help Reduce Maintenance Backlog.» GAO-25-108400. Retrieved from https://www.gao.gov/products/gao-25-108400
[2] Facilio. (2024). «Deferred Maintenance Meaning, Cost, and How to Reduce It.» Referenced BOMA 2024 report. Retrieved from https://facilio.com/blog/deferred-maintenance/
[3] UpKeep. Referenced in: RueVac Property Services. (2024). «The Hidden Cost of Deferred Maintenance: A Commercial Property Manager’s Guide to Preventive Maintenance ROI.» Retrieved from https://www.ruevac.com/the-hidden-cost-of-deferred-maintenance-a-commercial-property-managers-guide-to-preventive-maintenance-roi/
[4] FacilitiesNet. «The Real Cost of Deferred Maintenance.» Referenced Stanford University Guidelines for Life Cycle Cost Analysis. Retrieved from https://www.facilitiesnet.com/maintenanceoperations/tip/The-Real-Cost-of-Deferred-Maintenance–38366
[5] U.S. Energy Information Administration. (2012). Commercial Building Energy Consumption Survey. Referenced building age statistics.
[6] FacilitiesNet. (2025). «GAO Spotlights Deferred Maintenance in Federal Buildings.» Retrieved from https://www.facilitiesnet.com/maintenanceoperations/tip/GAO-Spotlights-Deferred-Maintenance-in-Federal-Buildings–55243
[7] RueVac Property Services. (2024). Referenced Jones Lang LaSalle study on preventive maintenance impact on equipment lifespan.
[8] U.S. Department of Energy. (2017). Analysis of utility cost increases from deferred maintenance, calculated at $1.16 per square foot. Referenced in: Strada Real Estate Services. Retrieved from https://stradarealestate.com/how-much-is-your-deferred-maintenance-costing-you/
[9] Insurance premium increases referenced in multiple industry sources related to poorly maintained commercial buildings, 2023-2024.
[10] FacilitiesNet. «The Real Cost of Deferred Maintenance.» Industry experts estimate 2-6% of annual operating budget should be spent on preventative maintenance.
[11] Jones Lang LaSalle. Study analyzing 14 million square feet of commercial properties demonstrating 545% ROI on preventive maintenance over 25 years, valued at $0.33 per square foot annually. Referenced in: RueVac Property Services. (2024).
About Sweven
Sweven’s Facility Maintenance Engine automates preventive maintenance execution across multi-location portfolios. The system operates 24/7, executing scheduled inspections, assigning qualified vendors, and ensuring completion without human intervention. Learn more at www.swevenbpm.com
This newsletter is part of our Modern Facility Management series. Subscribe for weekly insights on automation, cost optimization, and industry trends.